
What is Peak Time Performance?
Updated: 1 day ago

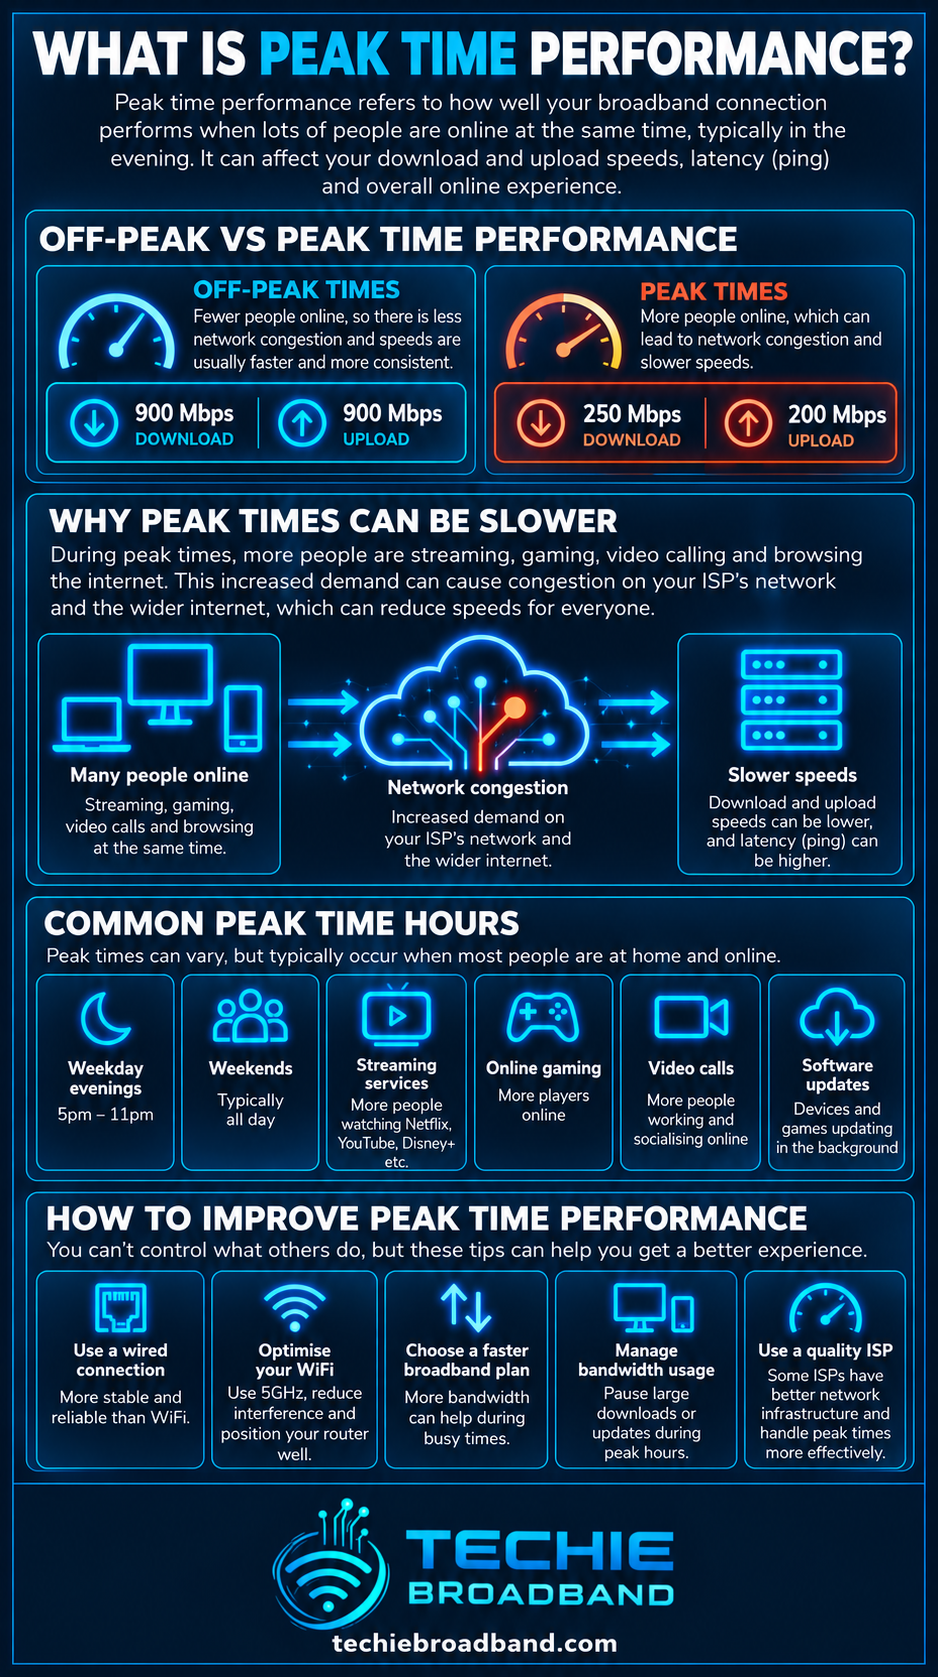
Peak time performance describes how well a broadband connection behaves when network demand is at its highest. For UK residential broadband, Ofcom uses 8pm to 10pm as the peak-time window. A connection with good peak time performance continues to deliver strong throughput, stable latency and low packet loss when many customers are online at the same time. The key distinction is that headline speed describes a product rate, while peak time performance shows how well the service holds up under shared demand.
What is peak time performance?
Peak time performance is the real-world behaviour of a broadband service during its busiest recurring period. It is not one single measurement. Download throughput matters, but so do upload throughput, latency, jitter and packet loss. A connection can retain most of its headline download speed yet still feel worse in the evening if queues build and latency rises under load.
This is why peak time performance should be understood alongside bandwidth, download speed, upload speed and symmetrical speeds. Each describes a different part of broadband behaviour.
When is broadband peak time in the UK?
For residential services, Ofcom's broadband speeds guidance defines busy time as 8pm to 10pm. For business services the corresponding peak period is 12pm to 2pm. These windows matter because UK speed estimates and advertising rules are designed to reflect performance when networks are busy, not only when they are quiet.
Peak time does not mean every network reaches maximum utilisation at exactly 8pm. Traffic patterns differ by ISP, access network, geography, day of week and major events. It is a standard comparison window, not a claim that congestion begins and ends at fixed clock times.
What happens to broadband at peak time?
Broadband networks contain shared resources. As simultaneous demand rises, utilisation increases across access, aggregation, backhaul, ISP core, peering and transit links. If a relevant link approaches its usable capacity, packets begin to queue. If queues grow, latency rises. If demand exceeds what the link and its buffers can absorb, throughput can fall and packets may be dropped.
Throughput can fall because flows compete for constrained capacity.
Latency can rise as packets wait in queues.
Jitter can increase because queueing delay becomes less consistent.
Packet loss can appear if buffers overflow or equipment discards traffic.
Applications can react differently because TCP, QUIC, streaming clients and real-time traffic respond differently to congestion.
Contention and congestion are not the same thing
Contention means capacity is shared. Congestion means demand at a particular point is high enough to impair performance. A network can be contended without being congested if it has sufficient engineered capacity for the traffic being carried.
This distinction matters because residential broadband is normally a shared service somewhere in the end-to-end path. Sharing itself is not evidence of poor engineering. The useful question is whether shared capacity is provisioned so that customers continue to receive acceptable performance during busy periods.
What does Ofcom's UK data show?
The last detailed Ofcom Home Broadband Performance measurement, using March 2023 data, found an average maximum download speed of 71.0 Mbit/s across all measured connections and an average 8pm to 10pm peak-time speed of 67.7 Mbit/s. That means peak-time performance retained about 95.4% of the average maximum speed. Ofcom described the effect of network congestion during busy periods as lowest for full-fibre lines. See the Ofcom March 2023 home broadband performance report.
Techie Broadband calculation: the average peak-time reduction
Using Ofcom's 71.0 Mbit/s average maximum and 67.7 Mbit/s peak-time result: 71.0 minus 67.7 equals 3.3 Mbit/s. Dividing 3.3 by 71.0 gives a reduction of about 4.65%. Put another way, the measured peak-time speed retained about 95.35% of the average maximum.
This is an aggregate result across the measurement panel. It does not mean every household should expect a 4.65% evening reduction. Some connections will show almost no change, while a locally or provider-constrained service can show a much larger change.
How did different speed groups perform?
Ofcom's March 2023 measurements also show why a single national percentage hides useful detail.
Packages above 10 Mbit/s and below 30 Mbit/s averaged 12.1 Mbit/s maximum and 11.2 Mbit/s at peak time, retaining about 92.6%.
Packages from 30 Mbit/s to below 300 Mbit/s averaged 68.4 Mbit/s maximum and 65.0 Mbit/s at peak time, retaining about 95.0%.
Packages advertised at 300 Mbit/s or more averaged 517.6 Mbit/s maximum and 496.0 Mbit/s at peak time, retaining about 95.8%.
Why the latest Ofcom report does not contain the same time-of-day table
There is an important evidence point here. In Connected Nations 2025, Ofcom states that it no longer reports time-of-day performance information because the variation across the day reported in 2024 was low enough to be of limited use to consumers comparing services.
That does not prove peak-time congestion has disappeared. It means the national time-of-day variation in the data had become small enough that Ofcom stopped treating the metric as particularly useful for service comparison. A specific ISP, local segment or household can still experience a recurring evening problem.
Why peak time still matters in 2026
UK networks are carrying more traffic and faster access services. Ofcom's Connected Nations Spring 2026 update reports gigabit-capable broadband availability at 89% of UK homes as of January 2026. Connected Nations 2025 reported the UK average maximum download speed rising from 223 Mbit/s in 2024 to 285 Mbit/s in 2025.
Faster access lines change where bottlenecks appear. A 1 Gbps or multi-gigabit line can make local Ethernet, WiFi, router processing, ISP aggregation, peering or the remote server more visible as constraints. The access line is only one part of the path.
Peak demand is not just about video streaming
Evening demand is created by many overlapping activities: 4K streaming, game downloads and updates, cloud synchronisation, video calls, social media video, operating system updates, backups, remote access and multiple devices performing background transfers.
Large game patches are a useful illustration because they create unusually concentrated demand. Openreach reported in September 2025 that peak usage on its network typically occurs between 8pm and 10pm, and that major Fortnite updates had coincided with record traffic spikes during 2025.
Where can peak-time congestion occur?
A slowdown can occur at more than one point. Treat the connection as an end-to-end system rather than assuming the access line is responsible.

The remote service or content delivery platform can be busy.
Peering or transit capacity between networks can constrain a route.
The ISP core or aggregation layer can become heavily utilised.
Backhaul from an access network can be constrained.
A shared access segment can become busy depending on technology and design.
Your own router can queue packets when the connection is saturated.
WiFi can become busier in the evening as your household and neighbours use more wireless devices.
The end device, Ethernet interface, storage or application can cap measured throughput.
FTTP and peak time performance
FTTP removes the copper access-line limitations associated with ADSL and FTTC, but it does not make the complete internet path dedicated. Passive optical networks share optical capacity between premises, and traffic is aggregated further upstream. What matters is whether those shared stages have enough capacity for actual demand.
Ofcom's March 2023 research found the effect of busy-period congestion was lowest for full-fibre lines. That is useful evidence, but it should not be turned into the claim that FTTP can never suffer congestion.
FTTC and copper-based services
FTTC performance is influenced by two separate classes of issue. The VDSL access line itself is affected by copper length, quality and interference, while traffic further into the network is shared. A line that syncs at the same rate all day can therefore still show lower application throughput at busy times if congestion exists elsewhere.
Cable broadband
Cable networks also use shared capacity. Ofcom's historical performance work found greater busy-time variation on cable than full fibre in the measured samples and explained that congestion can occur closer to the customer in cable topologies. Modern network upgrades can change this picture, so historical technology-level results should not be treated as a verdict on every current cable segment.
Fixed wireless and mobile broadband
4G, 5G and fixed wireless access introduce radio capacity, signal quality and cell loading into the equation. A service can test strongly in a quiet period and slow when more users share the same radio resources. Weather, propagation, spectrum, backhaul and network management can also affect results.
Peak time throughput versus peak time latency
Speed tests often focus attention on Mbps, but latency under load can be more noticeable than a modest throughput reduction. When queues become deep, interactive traffic waits behind bulk transfers. Web browsing can feel less responsive, gaming can become unstable and voice or video calls can suffer even though a speed test still reports hundreds of megabits per second.
Bufferbloat can look like ISP congestion
If your own connection is saturated by a large download or upload, excessive queueing in the router can cause latency to rise sharply. This is bufferbloat. It can occur at any time, but households often notice it in the evening because that is when simultaneous activity is highest.
A useful diagnosis therefore compares idle latency with loaded latency. If latency rises only when your own traffic saturates the line, local queue management may be the main issue. If minimum latency and throughput worsen at the same evening times even when your household is otherwise idle, wider congestion becomes more plausible.
WiFi can create a false peak-time pattern
Evening WiFi performance can degrade because more devices in your home and neighbouring properties are transmitting. That can produce a time-of-day pattern that resembles broadband congestion. A wired Ethernet test is therefore essential before drawing conclusions about the ISP.
Techie Broadband practical example
Imagine a 500 Mbps FTTP service that delivers 485 Mbps over wired Ethernet at 10am but repeatedly falls to 260 Mbps between 8pm and 10pm. If the router reports the same WAN link state, local traffic is paused, several capable test servers show the same pattern and the result repeats over multiple evenings, the evidence increasingly points beyond the local device and WiFi.
Now imagine the wired test remains around 485 Mbps at 9pm but a phone on WiFi falls from 400 Mbps to 120 Mbps. That points in a different direction. The broadband service is holding up while the wireless path is not.
How to test peak time performance properly
Connect a capable computer to the router using wired Ethernet.
Confirm the Ethernet link speed is high enough for the broadband package.
Pause cloud backups, game downloads, streaming and other heavy household traffic.
Run several tests during a quiet period and record download, upload and latency.
Repeat the same tests between 8pm and 10pm.
Use more than one reputable test server or service.
Compare idle latency with latency while the connection is under load.
Repeat the process across several days rather than diagnosing from one evening.
If possible, compare router or ONT statistics so a physical line issue is not confused with congestion.
Only after isolating the local network should you raise a recurring peak-time pattern with the provider.
How to calculate your own peak-time retention
A simple comparison is: peak-time throughput ÷ quiet-time throughput × 100. If a connection delivers 940 Mbps when quiet and 850 Mbps at peak, 850 ÷ 940 × 100 gives about 90.4% retention. The reduction is about 9.6%.
Use this as a diagnostic indicator, not a universal quality score. A lower result caused by a busy remote test server tells you less about your broadband than the same pattern reproduced across multiple independent destinations.
What is a good peak time result?
There is no single percentage that makes every broadband service good or bad. A useful result is one that remains close to the service's normal wired performance and keeps latency, jitter and packet loss stable enough for the applications you use.
For a fast connection, a small percentage reduction can still represent tens of megabits per second. Conversely, a slower connection can retain a high percentage yet still lack enough capacity for household demand. Both absolute performance and percentage retention matter.
Peak time performance and advertised broadband speeds
UK broadband advertising is deliberately tied to busy-time behaviour. The Advertising Standards Authority requires numerical broadband speed claims in advertising to be based on the download speed available to at least 50% of customers at peak time, described as an average.
This is one reason the number in an advert should not be interpreted as a guaranteed per-device transfer rate. Your actual result depends on the product, access line, network loading, home network and destination.
Minimum guaranteed speed is a different concept
A minimum guaranteed speed is a contractual or code-related threshold supplied by participating providers. It is not the same as an advertised average speed, a quiet-time maximum or the throughput of a single WiFi device. When investigating a fault, compare like with like and follow the provider's required test method.
Does a faster package fix peak-time congestion?
Not necessarily. If the bottleneck is your own product rate, a faster tier can add headroom. If the constrained point is a shared upstream link that affects the same customers, buying a faster headline tier may not remove the underlying congestion. The answer depends on where the bottleneck sits.
Does changing ISP fix it?
Sometimes. Two ISPs using the same physical access network can still have different backhaul, aggregation, peering, transit, routing and capacity policies. But if the problem is inside your home, changing ISP may reproduce the same symptom. Diagnosis should come before switching.
Why one speed test is weak evidence
A speed test measures a path to a particular server at a particular moment. The server, route and test method all matter. A single poor result can be caused by the test endpoint, WiFi, local traffic or a temporary routing event. Repeated wired tests against multiple destinations are much stronger evidence.
What to record before contacting your ISP
Date and exact test time.
Whether the test was wired or wireless.
Quiet-time and peak-time download and upload results.
Idle and loaded latency if available.
Test server or service used.
Whether other household traffic was paused.
Router WAN and Ethernet negotiated speeds.
Whether the pattern repeats on multiple evenings.
Any packet loss or obvious latency increase.
Whether the same device performs normally outside peak time.
Peak time performance FAQ
Why is my broadband slower at night?
If the slowdown repeatedly appears during busy evening periods, shared network congestion is one possibility. But increased household usage and busier WiFi can produce the same pattern. Compare wired tests at quiet and peak times before deciding which is responsible.
Is 8pm to 10pm always the busiest time?
It is Ofcom's standard residential peak-time window and the period used for UK broadband speed information and advertising comparisons. Individual networks can experience their highest load at a different time, particularly during unusual events.
Can full fibre slow down at peak time?
Yes. FTTP removes copper access limitations but still connects into shared network infrastructure. Ofcom's last detailed measurements found busy-period congestion had the lowest effect on full-fibre lines, not that the effect was impossible.
Does peak time affect latency as well as speed?
It can. When links become highly utilised, packets may wait in queues. That can increase latency and jitter before a dramatic fall in throughput becomes obvious.
How many days should I test?
There is no mandatory universal number for diagnosis, but several comparable tests across multiple days are much more useful than one result. The objective is to establish whether a repeatable time-of-day pattern exists.
The key point
Peak time performance is a stress test of the complete broadband path. Good service is not merely a large headline Mbps figure. It is the ability to maintain useful throughput and responsive latency when customers actually want to use the network. Measure it with repeatable wired tests, separate local WiFi from the broadband line, compare quiet and busy periods, and treat the entire path as a system.
To explore the related technical concepts used in this Peak Time Performance guide, visit our broadband terminology guide.
