
What is Traceroute?
Updated: 2 days ago

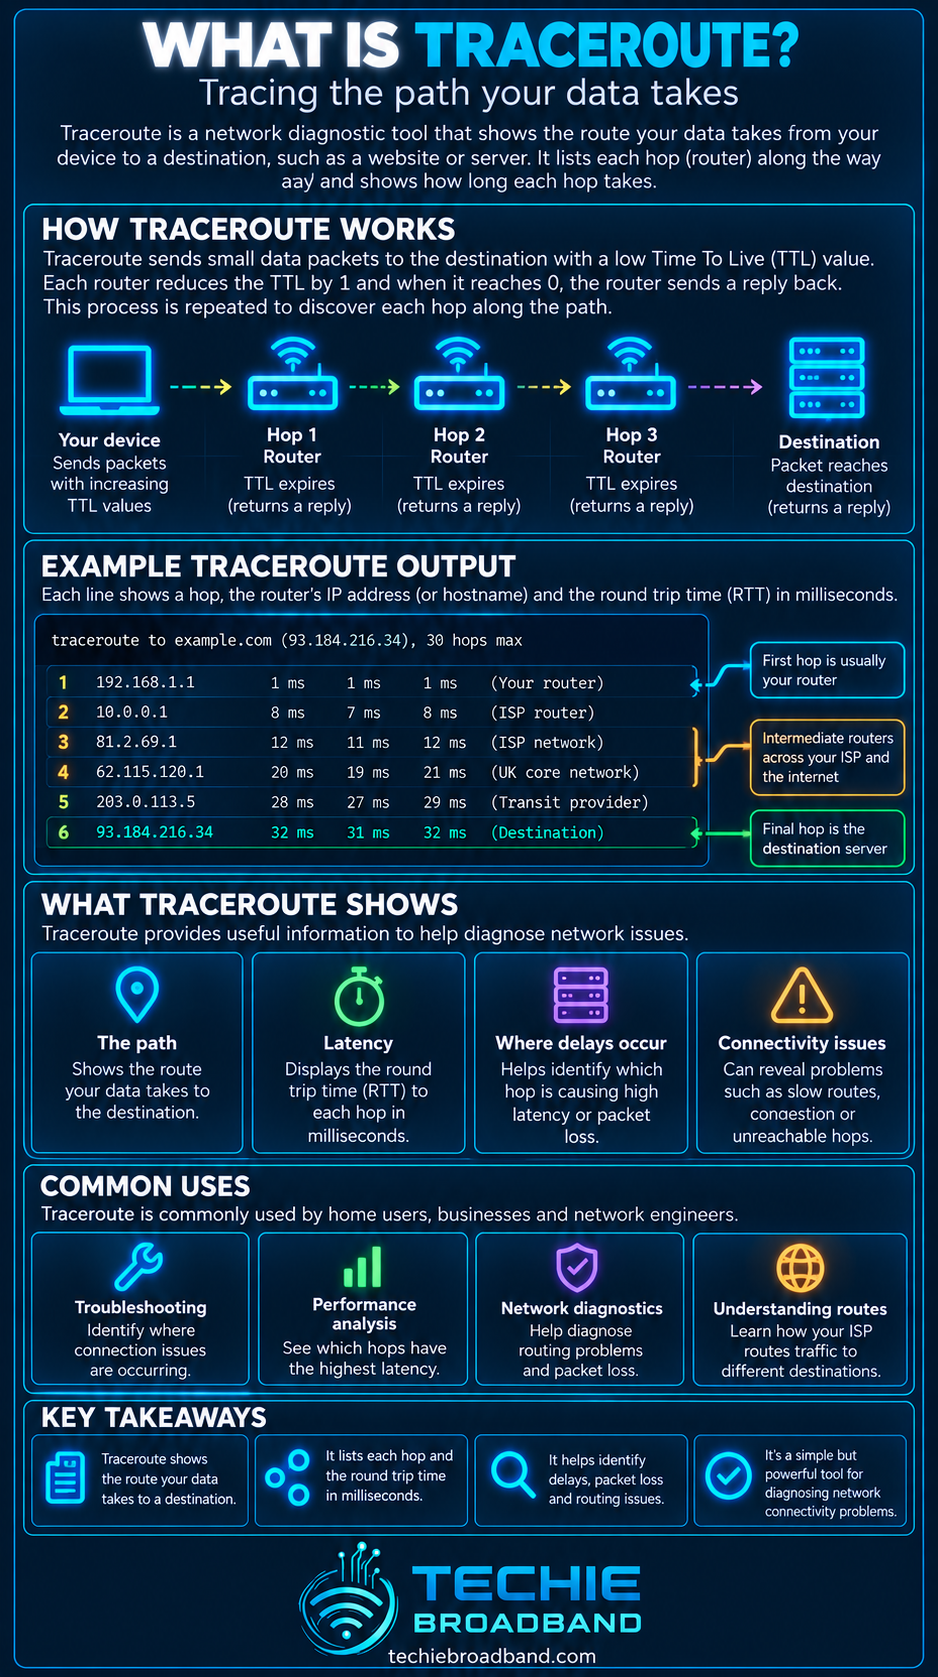
Traceroute is a network diagnostic tool that shows the responding IP hops between your device and a destination. It works by sending probes with progressively larger IPv4 Time To Live values, or IPv6 Hop Limit values, so successive routers can return expiry messages. The important distinction is that traceroute shows a measured view of the route seen by its probes, not a guaranteed physical map of every device or cable carrying your traffic.
For broadband troubleshooting, traceroute can help identify where a route changes, where replies stop, how round trip time develops along a path and whether a problem appears local, inside an ISP, at an interconnection point or closer to the destination. It cannot, on its own, prove that a particular router is congested or dropping ordinary user traffic.
How does traceroute work?
Every routed IP packet carries a lifetime field. In IPv4 this is called Time To Live, usually shortened to TTL. Routers decrement it as the packet is forwarded. When the value reaches zero, the router normally discards the packet and can return an ICMP Time Exceeded message to the sender.
This behaviour is fundamental to conventional traceroute. RFC 1393 describes the established traceroute technique as beginning with a TTL of 1 and increasing it to reveal successive responding hops.
Traceroute sends a probe with TTL 1. The first router decrements the TTL, the probe expires and that router can return ICMP Time Exceeded.
Traceroute sends another probe with TTL 2. The first router forwards it, the second router expires it and can reply.
The process repeats with progressively larger values.
When the destination responds, or the configured maximum hop count is reached, the trace ends.
Many implementations send several probes for each hop value. This is why a trace commonly shows multiple round trip time measurements on each line.
What does a traceroute result show?
A typical result contains a hop number, a hostname or IP address when one is available, and one or more round trip time measurements in milliseconds. An asterisk usually means that a particular probe did not receive a reply before its timeout. The exact display varies by operating system and traceroute implementation.
Hop number: the position at which a probe expired or the destination replied.
IP address: the source address used by the responding device for its reply.
Hostname: a reverse DNS name when one can be resolved.
RTT: the time from sending the probe to receiving its response.
Asterisk or timeout: no qualifying reply arrived for that probe within the wait period.
The RTT shown beside an intermediate hop is not the one way delay from that router to the next router. It is a round trip measurement from your device to the responding hop and back, and the reply may take a different return route.
Traceroute, ping and MTR are different tools
Ping primarily tests whether a destination responds and measures end to end round trip time. Traceroute attempts to reveal responding hops along the outward route. MTR combines repeated path probing with ongoing measurements, which can make persistent patterns easier to spot. None of them should be interpreted without understanding how ICMP and routing policy affect the results.
Traceroute probe types: UDP, ICMP and TCP
Traceroute is an application rather than a single wire protocol, so implementations differ. Traditional Unix style traceroute commonly uses UDP probes. Windows tracert commonly uses ICMP Echo probes. Other tools can use TCP probes, which can be useful when a network treats ICMP, UDP and TCP differently.
The IETF overview of operations and maintenance tools in RFC 7276 notes that traceroute has different implementations and can use UDP, ICMP or TCP probe messages.
A trace that fails with one probe type can therefore work with another. That does not necessarily mean the data path itself is broken. A firewall, router control plane or security policy may simply handle the probe or its reply differently.
Traceroute and IPv6
IPv6 uses a Hop Limit field rather than the IPv4 TTL name, but the diagnostic principle is similar: the value is reduced as the packet passes through routers and expiry can trigger an ICMPv6 Time Exceeded response. IPv4 and IPv6 can take different routes, so testing both address families can reveal materially different paths or behaviour.
Traceroute is measuring responding hops, not drawing a perfect route map
This is the most important limitation to understand. A line in traceroute represents a response to a probe. It does not prove that every forwarding device is visible. Some devices do not answer. Tunnels can hide intermediate infrastructure. MPLS and other forwarding mechanisms can change what is exposed. A responding interface address may not identify the exact physical chassis or geographic location you imagine.
Modern route measurement is complicated further by load balancing. RFC 9198 discusses ECMP and advanced traceroute methods designed to keep probes associated with a flow and improve path assessment.

Why can traceroute show different routes on repeated tests?
Internet routes are not permanently fixed. Routing policy can change, links can fail, traffic can be moved, and equal cost multipath routing can distribute flows across more than one next hop. Even during one conventional trace, different probes can be treated as different flows and take different equal cost paths.
BGP or internal routing changes can alter the selected path.
ECMP can place different flows on different links or routers.
Maintenance or failure can move traffic to a backup route.
Traffic engineering can intentionally change interconnection or transit paths.
IPv4 and IPv6 may follow different networks.
A CDN can direct apparently similar services to different destination infrastructure.
What do asterisks in traceroute mean?
An asterisk means traceroute did not receive the expected reply for that probe within the configured timeout. It does not automatically mean user traffic is being lost at that hop.
A router may forward transit traffic normally while rate limiting, filtering or deprioritising the ICMP response generated by its own control plane. If a hop shows asterisks but later hops and the destination respond normally, the silent hop is plainly forwarding at least those probes onward.
Why high latency at one hop can be misleading
Suppose hop 6 replies in 95 ms, but hops 7, 8 and the destination consistently reply in 18 to 22 ms. It is not physically meaningful to conclude that every packet spent an extra 75 ms crossing hop 6 and then somehow recovered that time. A much more likely explanation is that hop 6's own diagnostic reply was delayed or deprioritised.
Persistent latency that first appears at a hop and remains elevated through every later responding hop, including the destination, is more interesting. Even then, traceroute alone cannot establish the root cause because the return path and probe handling remain unknown.
Techie Broadband diagnostic interpretation
A useful way to read a trace is to look for persistence rather than isolated numbers. Treat each hop as evidence in an end to end sequence, not as an independent speed test.
One slow intermediate reply followed by normal later replies: weak evidence of a forwarding problem.
One silent intermediate hop followed by normal later replies: usually evidence that the hop did not answer, not that it failed to forward.
RTT rises and stays high through later hops and the destination: investigate the point where the persistent change begins.
Loss appears at one hop but disappears later: do not label that hop as the source of packet loss.
Loss begins and continues through every later hop and the destination: potentially meaningful, but confirm with repeated end to end testing.
Different paths between tests: can be normal where routing or load balancing provides multiple paths.
A worked traceroute example
Consider a simplified UK broadband trace to an internet service. The figures below are a practical example, not measurements from a real ISP.
Hop 1, home router: 1 ms
Hop 2, ISP access edge: 6 ms
Hop 3, ISP aggregation: 7 ms
Hop 4, ISP core: 8 ms
Hop 5, interconnection: 12 ms
Hop 6, destination network: 14 ms
Destination: 15 ms
The end to end result is about 15 ms. You should not add 1 + 6 + 7 + 8 + 12 + 14 + 15 to claim 63 ms of path latency. Each displayed figure is already a round trip measurement from the source to that responding point. The progression is cumulative in distance through the path, not a set of per link delays to sum.
Original Techie Broadband analysis: using delta rather than adding hop RTTs
As a rough diagnostic observation, you can compare stable RTT levels between adjacent sections of a trace. In the example above, the shift from about 8 ms at the ISP core to about 12 ms at the interconnection is a 4 ms increase in source to hop RTT. The move from 12 ms to 15 ms at the destination is another 3 ms. These deltas can help identify where a persistent change begins, but they are not precise one way link delays because every measurement includes a return path that may differ.
Where traceroute sits in a UK broadband connection
A UK broadband trace can cross several administrative and technical layers. Depending on the ISP, access network, product and destination, responding hops may represent the home router, an access or aggregation layer, the ISP core, an interconnection or transit network, and the destination network.
On FTTP, the optical access infrastructure between the home and the ISP may not appear as a neat series of traceroute hops. Traceroute operates at the IP layer, so passive optical network components and Layer 2 infrastructure are not automatically exposed as individual IP hops. The same principle applies to switches and many tunnelled network sections.
Traceroute and routing
Traceroute observes the consequences of forwarding decisions, but it does not tell you the complete routing policy that produced them. BGP, internal routing protocols, static routes, ECMP and traffic engineering can all influence the path.
A router shown in traceroute is therefore not a statement that BGP selected that individual device. BGP can influence the interdomain path while internal routing and forwarding determine how traffic crosses each network.
Traceroute and peering or transit
A trace can sometimes provide clues that traffic has moved from one network to another, but hostnames and IP addresses should not be treated as definitive proof of the commercial relationship. An interconnection may involve peering, paid transit, private interconnects, an internet exchange or another arrangement that traceroute itself does not describe.
Traceroute and CGNAT
Carrier grade NAT can affect addressing near the subscriber edge, but traceroute is not a reliable CGNAT detector by itself. Private or shared address space in an early hop can be a clue, yet internal ISP addressing and tunnel design can produce similar observations. Confirm CGNAT by comparing the router's WAN address with the public address seen externally and by checking the ISP's documented service behaviour.
Traceroute over WiFi versus Ethernet
WiFi can add variable delay and packet loss before traffic even reaches the first routed hop. For serious broadband diagnosis, run a wired Ethernet test where practical. This reduces local wireless variability and makes it easier to separate an internet path issue from a home network issue.
Why traceroute does not reveal the return path
Conventional traceroute discovers responding points on the path taken by its outbound probes. The ICMP replies travel back to you according to the return routing available to each responding device. Internet routing can be asymmetric, so the route from you to a destination can differ from the route used in the opposite direction.
RFC 1393 explicitly notes that conventional traceroute does not trace the return path, which may differ from the outbound path. See the RFC Editor's traceroute specification for the underlying behaviour.
Traceroute, ECMP and false path changes
Equal cost multipath routing can hash traffic across several available next hops. Classic traceroute implementations may vary fields such as UDP ports between probes, causing routers to classify the probes as different flows. The result can look as if a single packet path jumps between routers when the output is actually sampling several valid paths.
Tools such as Paris traceroute were developed specifically to reduce this problem by controlling flow identifying fields. This matters when analysing modern ISP and data centre networks where ECMP is common.
What traceroute cannot tell you
It cannot prove the physical geographic location of a hop.
It cannot reveal every switch, optical component, tunnel or forwarding device.
It cannot prove that an intermediate router is dropping normal application traffic merely because it does not answer probes.
It cannot reveal the complete reverse path.
It cannot explain the commercial relationship between two networks.
It cannot identify congestion from one isolated high RTT value.
It cannot replace an end to end packet loss, latency or throughput test.
It cannot guarantee that the next connection will take exactly the same route.
How to run traceroute
Windows
Open Command Prompt or PowerShell and use tracert followed by the destination hostname or IP address. Windows tracert commonly uses ICMP Echo probes.
macOS and Linux
Open Terminal and use traceroute followed by the destination hostname or IP address. The available options and default probe method depend on the operating system and implementation.
When troubleshooting, record the destination, time, connection type and whether the test used IPv4 or IPv6. A trace without that context is much less useful.
A practical traceroute troubleshooting process
Connect the test device by Ethernet where possible.
Pause large downloads, uploads, cloud backups and other competing traffic.
Measure ordinary end to end latency and packet loss to the destination.
Run traceroute to the same destination.
Repeat the trace several times rather than trusting one snapshot.
Compare whether a latency increase or loss pattern persists through later hops.
Test another destination to determine whether the pattern is destination specific.
Compare IPv4 and IPv6 if both are available.
Repeat at a different time if you suspect peak time congestion.
If escalating to an ISP or network operator, provide the complete trace together with timestamps, source connection details and end to end test results.
How to investigate suspected peak time congestion
If performance degrades mainly in the evening, take comparable measurements at quiet and busy times. Use the same wired device, destination and test method. Compare end to end latency, loaded latency, packet loss, throughput and traceroute. A path change or persistent RTT increase can be useful supporting evidence, but traceroute should be one part of the evidence set rather than the entire diagnosis.
When should you contact your broadband provider?
Contact the provider when the problem is reproducible after local causes have been reduced and you can supply useful evidence. A good report includes the affected destination or service, timestamps, wired test results, whether IPv4 or IPv6 is affected, traceroute output from several attempts and any consistent point where end to end behaviour changes.
Do not simply report that 'hop 7 has packet loss' because one router ignored some probes. Explain the end to end symptom and use the trace to support it.
Common traceroute mistakes
Adding all hop RTT values together.
Treating every asterisk as packet loss.
Assuming the slowest responding hop is the bottleneck.
Assuming every hop is a separate physical router in a different location.
Using one trace as proof of a permanent route.
Ignoring WiFi variability at the source.
Ignoring asymmetric return routing.
Assuming reverse DNS hostnames are complete or current.
Assuming an IP address identifies the commercial relationship between networks.
Blaming the ISP before comparing multiple destinations and eliminating local causes.
Traceroute FAQs
Is traceroute the same as ping?
No. Ping primarily measures end to end reachability and round trip time to a target. Traceroute attempts to reveal responding hops along the route to that target.
Does an asterisk mean packet loss?
Not necessarily. It means the expected reply was not received for that probe before timeout. If later hops respond normally, the silent hop was still forwarding traffic.
Why does one traceroute hop show very high latency?
The router may be slow to generate or prioritise its own diagnostic reply while continuing to forward transit traffic normally. Look at later hops and the destination before drawing a conclusion.
Why do traceroute routes change?
Routing changes, ECMP, traffic engineering, failures and different flow hashes can all change what the probes reveal.
Can traceroute find where broadband congestion is?
It can provide clues, especially when a persistent latency change begins at one part of a path and remains through the destination. It cannot prove congestion by itself, so combine it with repeated end to end measurements.
Does traceroute show every router?
No. Devices may suppress replies, tunnels can hide infrastructure, Layer 2 equipment is not automatically visible and different probe types can produce different results.
Can traceroute test IPv6?
Yes, suitable traceroute implementations can test IPv6 paths. IPv6 uses Hop Limit rather than the IPv4 TTL field, and its route can differ from IPv4.
What is a good traceroute result?
There is no universal ideal hop count or RTT progression. A useful result reaches the destination with end to end performance appropriate for that destination and shows no persistent problem that continues through later hops. More hops do not automatically mean a worse connection.
Key takeaway
Traceroute is most useful when treated as a path observation tool, not a fault verdict. It reveals which IP hops choose to answer progressively expiring probes and gives round trip timing evidence for those responses. Read patterns across the complete trace, confirm them with the destination, repeat the measurement and combine it with other tests before deciding where a broadband problem actually sits.
To explore the related technical concepts used in this Traceroute guide, visit our broadband terminology guide.
